|
By Hannah Hoff
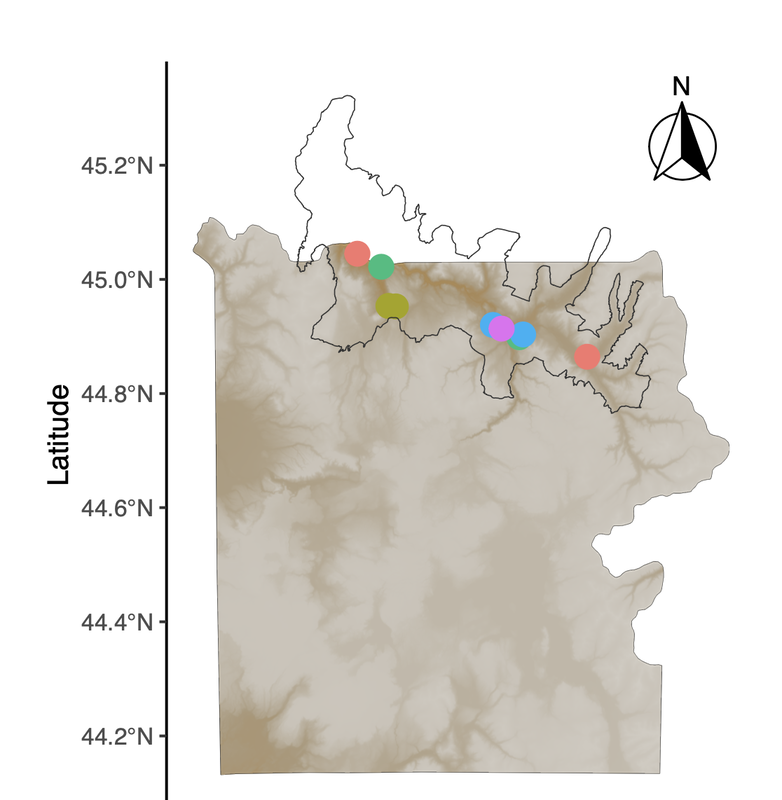
With many thanks to Hannah, map-making projects in the lab just got easier! Here is a detailed example of how to make maps in R that are both informative and visually striking. From the most basic building blocks, Hannah works through how to add detail to the map using well-developed R packages. The end result is a map that shows the locations of study sites or sample collections based on 'dummy data' that are not unlike the list of places where we work in Yellowstone National Park. Need to make an overview figure about your field sites for an upcoming manuscript or presentation? Make sure you say thanks to Hannah! :) A link to this PDF tutorial is also posted on the Lab Wiki, where we are making an effort at compiling more useful computing resources.
0 Comments
Your comment will be posted after it is approved.
Leave a Reply. |
AuthorComputational resources kindly contributed and explained by members of our community. Archives
May 2023
Categories
All
|

 RSS Feed
