|
By Hannah Hoff
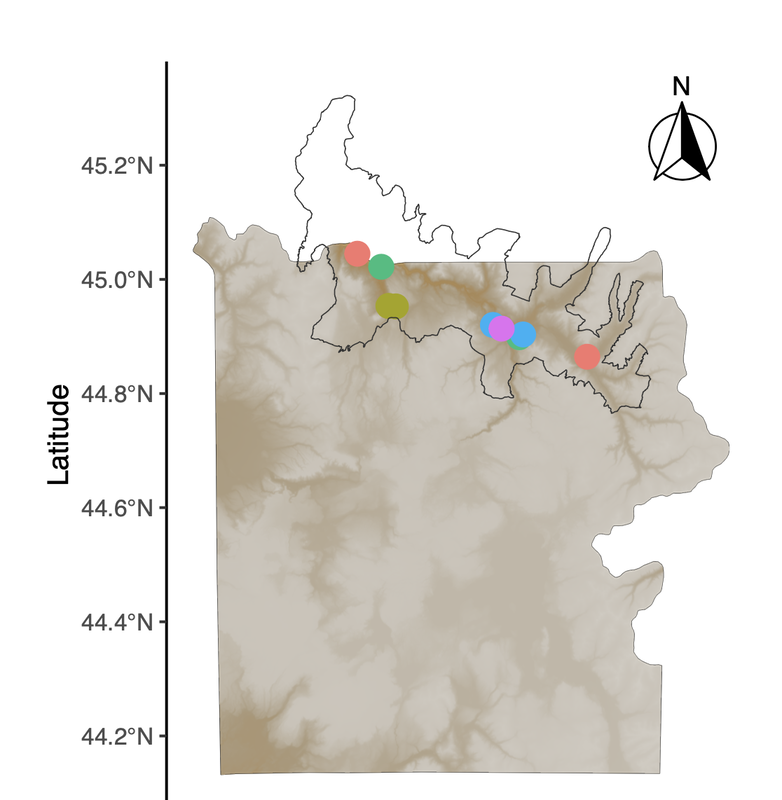
The most recent map-making tutorial focuses on unlocking the potential of rasters. We start by adding hillshade, which provides a clearer picture of the topography of the area by mimicking the sun's effects (illumination, shadows) on hills and mountains, which is particularly useful when mapping a place like Yellowstone National Park. However, when adding multiple layers onto a map, we suddenly end up with a number of different legends which may vary in utility and make the map look "busy." Simple functions allow us to suppress legends and guides that aren't useful, while retaining those that are. As usual, using well-documented and flexible packages like ggplot2 allow us to easily incorporate those functions, which may make downstream figure formatting more efficient. Thanks to the Kartzinel Lab for sharing ideas about useful map elements in a recent lab meeting :) A link to this PDF tutorial is available here. A link is also be posted on the Lab Wiki, where we are making an effort at compiling useful computing resources. Hannah has also set up a GitHub repository for these tutorials (https://github.com/hkhoff/Map-making-in-R-tutorials-), which includes the R code used in each tutorial, and the ('dummy') data that was created as an example of what sorts of data might be fed into the code; both files can be downloaded for a more interactive tutorial experience :)
0 Comments
By Hannah Hoff
Our last map-making tutorial provided code for basic sampling maps in R. In a continued effort to demystify the world of spatial analysis, Hannah has created a tutorial that builds on that foundation to share some useful functions for tailoring map designs to different types of studies. This tutorial uses a "finalized" map from Hannah's earlier post to create a map inset, which allows us to zoom in on areas of interest (sampling points, population ranges, etc.). This may be particularly useful for studies where sampling occurs in a very small area relative to the broader landscape, or in cases where there is substantial visual overlap between sample points. As some of our work in Yellowstone is focused on smaller areas, map insets have become a necessary part of our map-making pipeline! A link to this PDF tutorial is available here. A link is also be posted on the Lab Wiki, where we are making an effort at compiling useful computing resourcesHannah has also set up a GitHub repository for these tutorials (https://github.com/hkhoff/Map-making-in-R-tutorials-), which includes the R code used in each tutorial, and the ('dummy') data that was created as an example of what sorts of data might be fed into the code; both files can be downloaded for a more interactive tutorial experience :) By Bethan Littleford-Colquhoun
A huge debt of gratitude to Beth for organizing a google drive folder that shares our strategy for initial processing of dietary DNA metabarcoding data. This directory provides template documents and code that we use to download paired-end read data from our dietary metabarcoding workflows, assemble forward and reverse reads, perform initial quality controls, and evaluate sequencing success. There is also a tutorial for how to upload sample data to SRA for archiving, which we have started to do routinely. Some details are specific to our dietary analysis sequencing workflow and/or the specific sequencing service that we use, plus we have particular sample naming schemes that we use, but it should be pretty straightforward to adapt for a variety of similar goals. By Hannah Hoff
With many thanks to Hannah, map-making projects in the lab just got easier! Here is a detailed example of how to make maps in R that are both informative and visually striking. From the most basic building blocks, Hannah works through how to add detail to the map using well-developed R packages. The end result is a map that shows the locations of study sites or sample collections based on 'dummy data' that are not unlike the list of places where we work in Yellowstone National Park. Need to make an overview figure about your field sites for an upcoming manuscript or presentation? Make sure you say thanks to Hannah! :) A link to this PDF tutorial is also posted on the Lab Wiki, where we are making an effort at compiling more useful computing resources. By Hannah Hoff
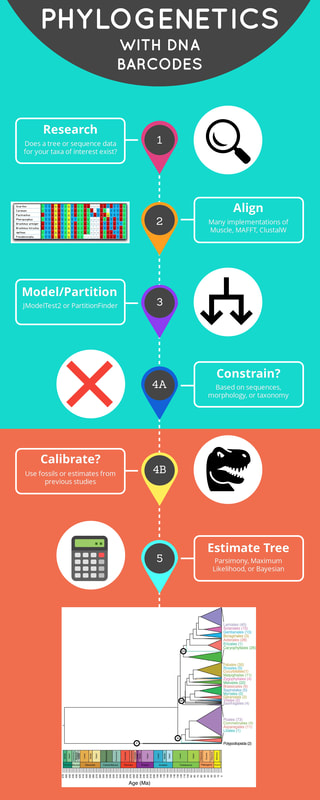
We have been doing a lot of plant DNA barcoding to build a library for the plants of the Greater Yellowstone Ecosystem. In the process, we have done some refinement to our lab's DNA barcoding protocols to increase clarity, efficiency, and reproducibility. Updated links to these protocols are available on the lab's wiki under the "Plant Barcoding" section for: trnL, rbcL, matK, and trnH-psbA markers. As part of Beth's critical review in Molecular Ecology on abundance-filtering strategies in DNA metabarcoding pipelines, we conducted simulations and sensitivity analyses to illustrate how key assumptions in the design of our bioinformatic strategies can introduce biases that undermine ecological interpretations of the data.
The Dryad repository for the paper contains data and code that will be useful for anyone who would like to replicate or enhance the simulations and/or sensitivity analyses. I consider this a major bioinformatic resource for researchers in the field, and an illustration of thoughtful research strategies that I hope others will build upon in a few key ways. The simulations we conducted are relatively simple, but extremely relevant. It would be rewarding to explore the relevance of other assumptions, parameters, data structures, and/or downstream ecological metrics. This would not only be of fundamental interest, but the developments and insights would be profoundly useful for all researchers in the field (us included). The Reviewers and Editors of this original manuscript seemed to agree with that sentiment. We briefly considered publishing an R Shiny App or similar to facilitate this type of exploration -- I still think it could be worthwhile, so please let us know if you would like to contribute! The sensitivity analyses model a strategy that I developed piecemeal over the years to help me check my assumptions about how robust my published conclusions would be and to be more persuasive with reviewers. Similar sensitivity analyses have been described in the supplementary materials in several publications in recent years. It requires a bit more work than simply using a plug-and-chug approach to bioinformatics and downstream analyses, but I think it pays off in terms of my own understanding of each study system and the reliability of my papers. I often encourage authors of papers that I review to consider doing something similar when their results are borderline, and I hope this code can serve as a resource to support that type of effort when appropriate. Collaborator Nick Harvey has kindly provided a formatted version of our current Mpala Plant DNA Barcode Reference Library that is suitable for taxonomic assignments using the R package dada2. You can download the fasta file of reference library v.2.0 (corresponding to Gill et al. 2019) formatted for dada2 here.
Thank you, Nick, for making this time-saving resource available to share! We are often asked to provide advice or assistance building plant DNA reference libraries for use in dietary metabarcoding projects. To begin centralizing info on our methods and sharing some important lessons-learned from experience, I have created a section on the lab's wiki for building plant barcode libraries. I will treat the google docs that you can link to from there as living documents. All of the details provided are nested within two main goals. The first goal is to collect plant voucher specimens and plant DNA barcode samples that match in ways that can be clearly documented through their respective metadata sheets. This is critical for the long-term value of the data. The second goal is to ensure work done by field biologists and molecular biologists are mutually informative -- the best reference libraries are developed through the meaningful engagement of expert botanists who are knowledgeable in a local flora and the researchers who will be analyzing the laboratory data.
We love to archive relevant vouchers in the Brown University Herbarium. Please keep in mind that the herbarium is staffed by expert botanists. Properly collected specimens can be mounted, archived, and digitized by professional staff -- this greatly reduces the cost and complexity of fieldwork.
Following the recent publication of our plant DNA barcode library from Mpala Research Centre, Kenya, led by Brian Gill, we are happy to provide a set of files to serve as our local trnL-P6 reference library (version 2.0). These files were carefully prepared by Courtney Reed, to whom we are most grateful.
|
AuthorComputational resources kindly contributed and explained by members of our community. Archives
May 2023
Categories
All
|


 RSS Feed
